Combining Inductive Research Methods to Evaluate EdTech Products
I used inductive research methods evaluate the value-add of education products.
Client
TechChange
Tools
Miro, Trello, Dedoose
Role
Researcher
Year
2021
Background
When I joined the company at the beginning of the summer, I was given an open-ended research question:
‘What is a synchronous course'?’
The company’s Education team posed this question to me in order to set me on a path to help them sift through a huge aggregation of user data from past courses. They allowed me the freedom to choose the method as well as the scope of the research question, as long as I documented my process and presented my findings at the end of the summer, which I did, gladly.
Research Purpose
For my research purposes I extended the original question to include:
What are the strengths and weaknesses of a synchronous learning experience?
How can we improve the structure of future courses for as many participants as possible?
How can we use participant data to inform how we create future courses?
Using the Inductive Research Method
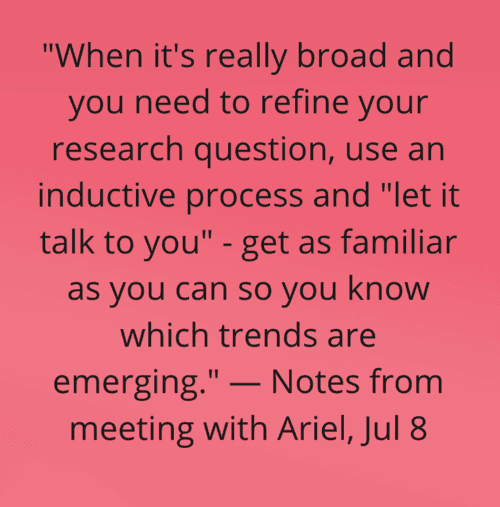
One particular account manager met with me and the other Fellow early into the process to discuss what kind of research we wanted to dive into. I had requested this meeting originally and am so glad I did — this AM introduced us to “inductive research”, or the opposite of what many people consider the normal research process, where you start with a hypothesis and work your way towards a result that either proves or disproves that hypothesis.
Outlining the Research Plan
1.
Collect data via interviews and surveys
2.
Analyze qualitative data using affinity mapping and coding
3.
Determine quantitative metrics using HEART matrix
3.
Analyze the quantitative data
3.
Synthesize and present to stakeholders
Why Inductive?
1.
lack of familiarity with the data and the open-ended nature of the research question
2.
most of the data available to me was qualitative and therefore easier to approach with an inductive method
3.
Evaluate the new experiences through qualitative + quantitative surveys
My data sources:
Course Feedback
feedback came in myriad ways -- surveys, online discussion threads
Interviews
I conducted six AM/ed team personnel interviews and seven participant interviews
Metadata
After meeting with my mentor, I submitted a request for some specific pieces of quantitative data that we knew the online course database tracks online (e.g. # user interactions over the span of a course)
Interview Process
I found the interviews especially helpful for validating some of my future insights gathered from other data sources.
13 Interviews
Catered interviews to internal vs. learner experience to best gauge course value/efficacy
Aggregation of Findings
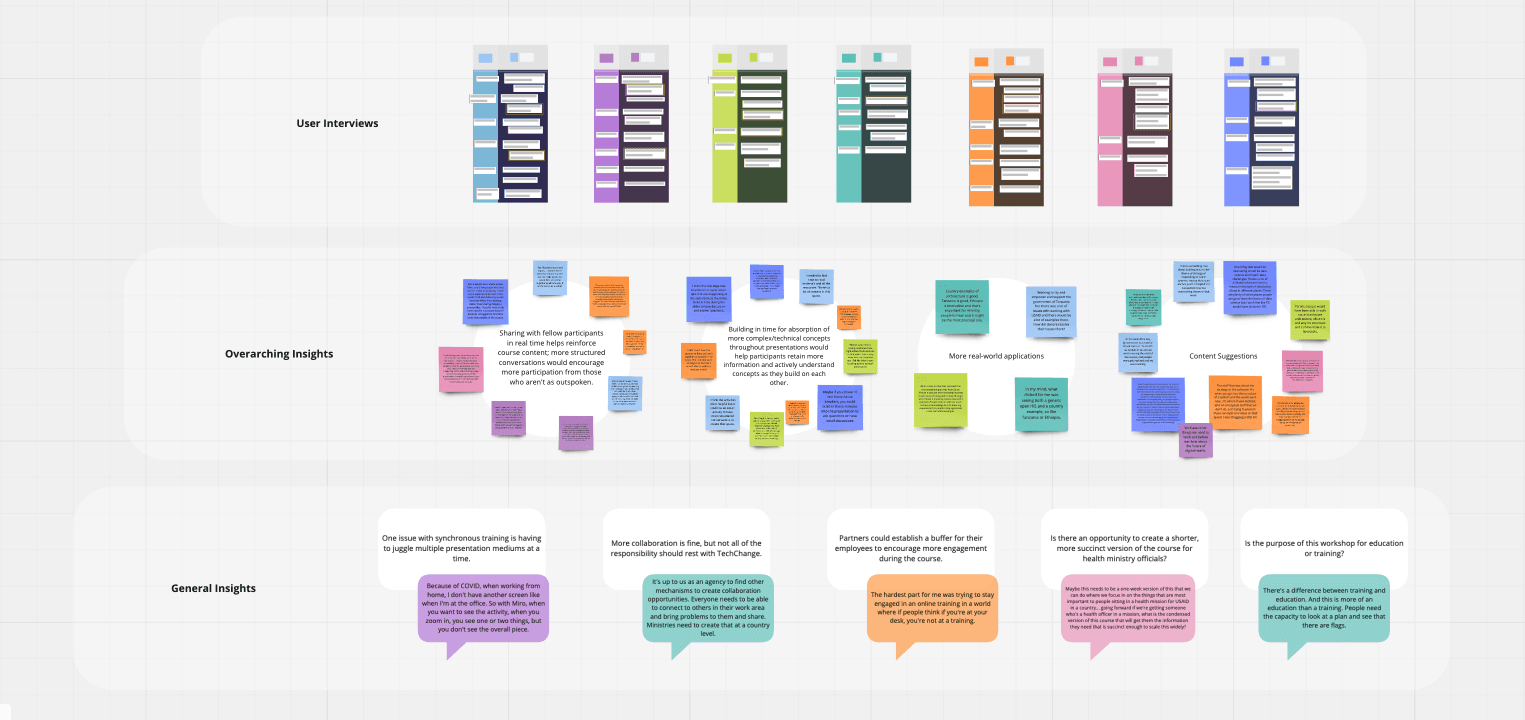
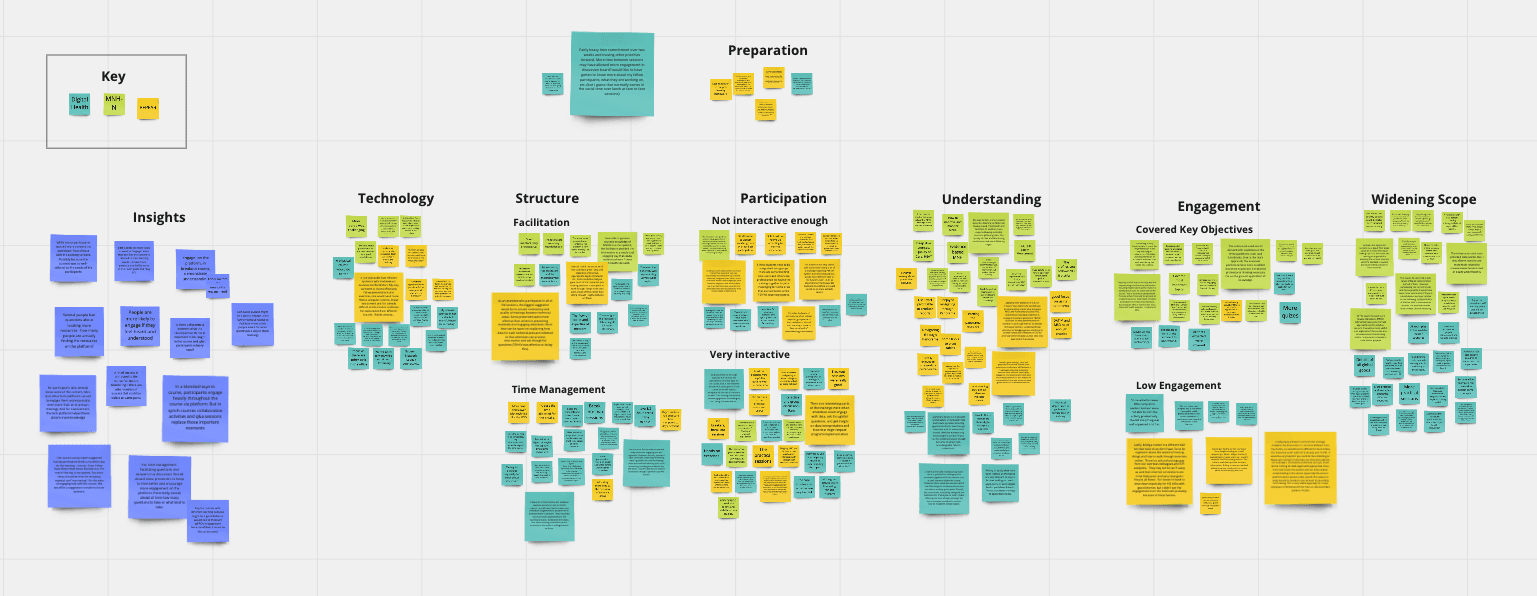
Conducted, transcribed and parsed; findings added to an affinity diagram for initial analysis
400 pieces of qualitative data
Prepped for coding
Challenges with data consistency
Some course teams had collected more data from past learners than others, making some areas of the data set skew towards one particular course. Each course team also varied in ways of extracting participant feedback, so data had to be normalized.
Results of HEART/OSM
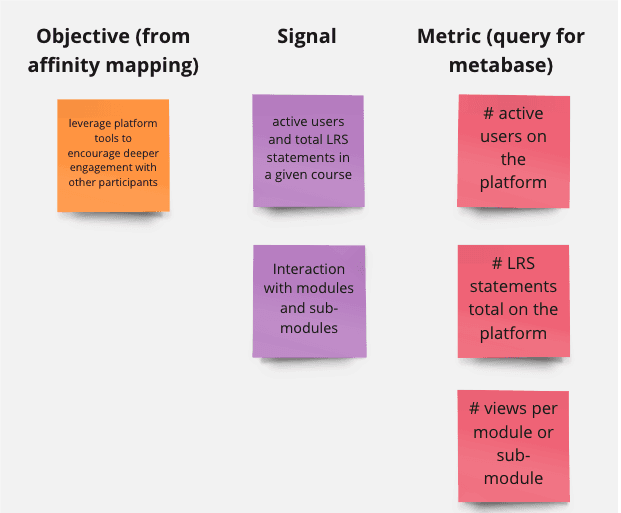
I defined five final metrics that I would use to analyze my quantitative data, which included:
Increase engagement with the platform’s resources throughout the course = # discussion posts + # active users on the platform + # interactions + # views per module
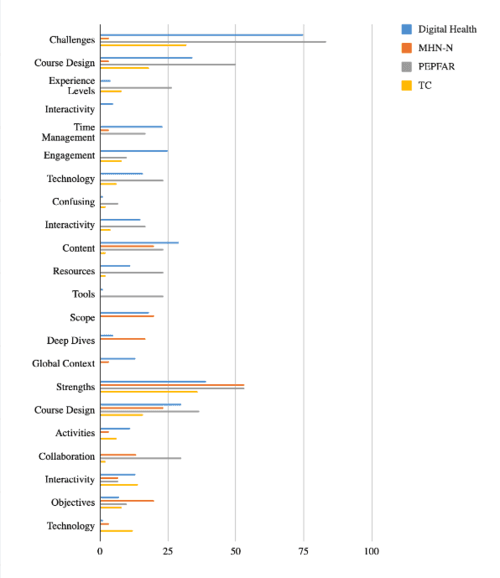
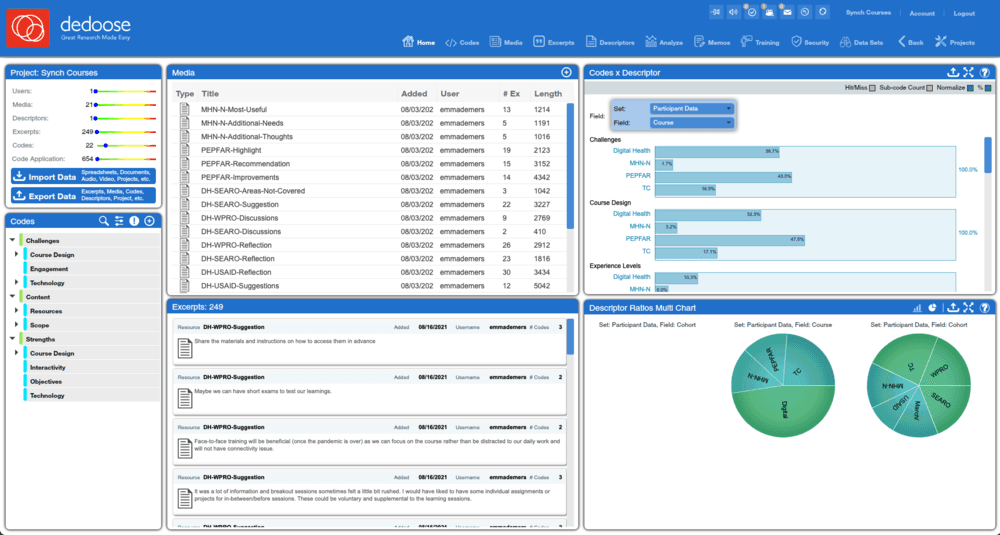
Qualitative Coding with Dedoose
Qualitative coding consists of taking a set of data (in my case, course survey feedback and interview snippets) and assigning each piece a set of attributes. Each attribute corresponds to one aspect of the data I wanted to analyze.
1.
Create a codebook of attributes using previous affinity mapping exercise
2.
Upload data set to Dedoose
3.
Code each data with 3 attributes
3.
Code again with a hierarchy (3 distinct levels of code instead of just 3 attributes)
3.
Export coded data and organize as matrices in Excel, to be viewable by others

Aggregating different forms of data
I iterated on potential information architecture using both user data and engineering limitations as references that would serve as the groundwork for all future iterations.
Data Analysis: Affinity Mapping and Qualitative Coding
I was previously familiar with affinity mapping and in this scenario I found it especially helpful so I could begin visualizing the data I had collected before conducting an even more thorough analysis via coding.
Quantitative Analysis with HEART and OSM
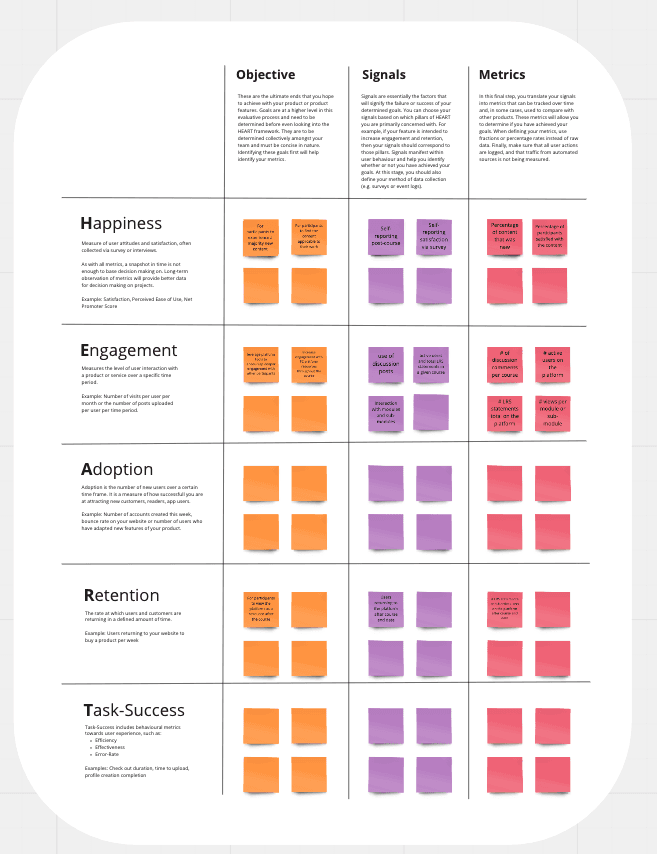
HEART was created by UX researchers at Google and stands for Happiness, Engagement, Adoption, Retention, and Task Success. OSM is Objectives, Signals and Metrics.
Flexibility of these categories made HEART the best analysis choice for this research project. I also used OSM to identify key metrics.
Initial Insights
For participants who already knew some of the content, Miro and other tech platforms served to engage them more
In a blended/asynchronous course, participants engage heavily throughout the course via platform. But in synchronous courses collaborative activities and Q&A sessions replace those important moments
Participants are more likely to want to engage when they feel like the content is tailored to their learning needs - it feels more personal and fulfills more of their goals (acts as the “buy in”)
Synchronous courses have a value add wherever participants are allowed to actively and verbally participate
All other insights centered around challenges, course design, scope and time management
Final Research Insight
Opportunity
For participants who already knew some of the content, Miro and other tech platforms served to engage them more
Work with implementation team to develop a plan for potential onboarding to this new tool that won't impede customer workflow
In a blended/asynchronous course, participants engage heavily throughout the course via platform. But in synchronous courses collaborative activities and Q&A sessions replace those important moments
Continue working with sales, services and implementation to review feature maintenance and discuss implementation steps
Participants are more likely to want to engage when they feel like the content is tailored to their learning needs - it feels more personal and fulfills more of their goals (acts as the “buy in”)
Include these users with any future higher ed research and continue discussions around budgeting
Synchronous courses have a value add wherever participants are allowed to actively and verbally participate
Include these users with any future higher ed research and continue discussions around budgeting

Reception and Key Takeaways
1.
Stakeholders expressed their surprise at some of the insights and suggested that my research would influence the way they shape future courses.
2.
Reversing the normal deductive research approach streamlined the process of narrowing down the huge amount of data that has never been aggregated before.
3.
Consistent data collection would make course comparison easier: since every course has a different way of collecting information from its participants, it’s a little difficult to directly cross-compare every aspect of every course. If I could conduct this research project again, I would implement a strategy to take the data variations into account.
4.
The depth and breadth of research I had the opportunity to conduct was incredibly rewarding. I especially enjoyed working through some of the more poignant points with my ed team members.
Skills
Inductive Research, HEART Matrix Analysis, Affinity Mapping, Metadata Analysis, Sprint Planning, User Interviewing, Research Synthesis, Qualitative Data Coding
Deliverable(s)
Qualitative analysis matrix, Quantitative visualization, Research summary presentation, Qualitative codebook
Impact
Stakeholders were able to prioritize areas of future development for live edtech products based on user engagement and adoption rates analysis.
Combining Inductive Research Methods to Evaluate EdTech Products
I used inductive research methods evaluate the value-add of education products.
Client
TechChange
Tools
Miro, Trello, Dedoose
Role
Researcher
Year
2021
Skills
Inductive Research, HEART Matrix Analysis, Affinity Mapping, Metadata Analysis, Sprint Planning, User Interviewing, Research Synthesis, Qualitative Data Coding
Deliverable(s)
Qualitative analysis matrix, Quantitative visualization, Research summary presentation, Qualitative codebook
Impact
Stakeholders were able to prioritize areas of future development for live edtech products based on user engagement and adoption rates analysis.
Background
When I joined the company at the beginning of the summer, I was given an open-ended research question:
‘What is a synchronous course'?’
The company’s Education team posed this question to me in order to set me on a path to help them sift through a huge aggregation of user data from past courses. They allowed me the freedom to choose the method as well as the scope of the research question, as long as I documented my process and presented my findings at the end of the summer, which I did, gladly.
Research Purpose
For my research purposes I extended the original question to include:
What are the strengths and weaknesses of a synchronous learning experience?
How can we improve the structure of future courses for as many participants as possible?
How can we use participant data to inform how we create future courses?
Using the Inductive Research Method
One particular account manager met with me and the other Fellow early into the process to discuss what kind of research we wanted to dive into. I had requested this meeting originally and am so glad I did — this AM introduced us to “inductive research”, or the opposite of what many people consider the normal research process, where you start with a hypothesis and work your way towards a result that either proves or disproves that hypothesis.
Outlining the Research Plan
1.
Collect data via interviews and surveys
2.
Analyze qualitative data using affinity mapping and coding
3.
Determine quantitative metrics using HEART matrix
3.
Analyze the quantitative data
3.
Synthesize and present to stakeholders
Why Inductive?
1.
lack of familiarity with the data and the open-ended nature of the research question
2.
most of the data available to me was qualitative and therefore easier to approach with an inductive method
3.
Evaluate the new experiences through qualitative + quantitative surveys
Aggregating different forms of data
I iterated on potential information architecture using both user data and engineering limitations as references that would serve as the groundwork for all future iterations.
My data sources:
Course Feedback
feedback came in myriad ways -- surveys, online discussion threads
Interviews
I conducted six AM/ed team personnel interviews and seven participant interviews
Metadata
After meeting with my mentor, I submitted a request for some specific pieces of quantitative data that we knew the online course database tracks online (e.g. # user interactions over the span of a course)
Interview Process
I found the interviews especially helpful for validating some of my future insights gathered from other data sources.
13 Interviews
Catered interviews to internal vs. learner experience to best gauge course value/efficacy
Aggregation of Findings
Conducted, transcribed and parsed; findings added to an affinity diagram for initial analysis
400 pieces of qualitative data
Prepped for coding
Data Analysis: Affinity Mapping and Qualitative Coding
I was previously familiar with affinity mapping and in this scenario I found it especially helpful so I could begin visualizing the data I had collected before conducting an even more thorough analysis via coding.
Initial Insights
For participants who already knew some of the content, Miro and other tech platforms served to engage them more
In a blended/asynchronous course, participants engage heavily throughout the course via platform. But in synchronous courses collaborative activities and Q&A sessions replace those important moments
Participants are more likely to want to engage when they feel like the content is tailored to their learning needs - it feels more personal and fulfills more of their goals (acts as the “buy in”)
Synchronous courses have a value add wherever participants are allowed to actively and verbally participate
All other insights centered around challenges, course design, scope and time management
Challenges with data consistency
Some course teams had collected more data from past learners than others, making some areas of the data set skew towards one particular course. Each course team also varied in ways of extracting participant feedback, so data had to be normalized.
Quantitative Analysis with HEART and OSM
HEART was created by UX researchers at Google and stands for Happiness, Engagement, Adoption, Retention, and Task Success. OSM is Objectives, Signals and Metrics.
Flexibility of these categories made HEART the best analysis choice for this research project. I also used OSM to identify key metrics.
Qualitative Coding with Dedoose
Qualitative coding consists of taking a set of data (in my case, course survey feedback and interview snippets) and assigning each piece a set of attributes. Each attribute corresponds to one aspect of the data I wanted to analyze.
1.
Create a codebook of attributes using previous affinity mapping exercise
2.
Upload data set to Dedoose
3.
Code each data with 3 attributes
3.
Code again with a hierarchy (3 distinct levels of code instead of just 3 attributes)
3.
Export coded data and organize as matrices in Excel, to be viewable by others
Results of HEART/OSM
I defined five final metrics that I would use to analyze my quantitative data, which included:
Increase engagement with the platform’s resources throughout the course = # discussion posts + # active users on the platform + # interactions + # views per module
Final Research Insight
Opportunity
For participants who already knew some of the content, Miro and other tech platforms served to engage them more
Find ways to engage learners at their current level by including technology-based modifications
In a blended/asynchronous course, participants engage heavily throughout the course via platform. But in synchronous courses collaborative activities and Q&A sessions replace those important moments
Invest more resources into developing a robust online community to encourage more engagement with content before and after sessions
Participants are more likely to want to engage when they feel like the content is tailored to their learning needs - it feels more personal and fulfills more of their goals (acts as the “buy in”)
Adjust modules so they can be attuned to specific cohorts' backgrounds (e.g. tailor content to be health-oriented for health organizations)
Synchronous courses have a value add wherever participants are allowed to actively and verbally participate
Asynchronous courses should mirror synchronous counterparts when possible and allow for more speaking or interactivity
Reception and Key Takeaways
1.
Stakeholders expressed their surprise at some of the insights and suggested that my research would influence the way they shape future courses.
2.
Reversing the normal deductive research approach streamlined the process of narrowing down the huge amount of data that has never been aggregated before.
3.
Consistent data collection would make course comparison easier: since every course has a different way of collecting information from its participants, it’s a little difficult to directly cross-compare every aspect of every course. If I could conduct this research project again, I would implement a strategy to take the data variations into account.
4.
The depth and breadth of research I had the opportunity to conduct was incredibly rewarding. I especially enjoyed working through some of the more poignant points with my ed team members.